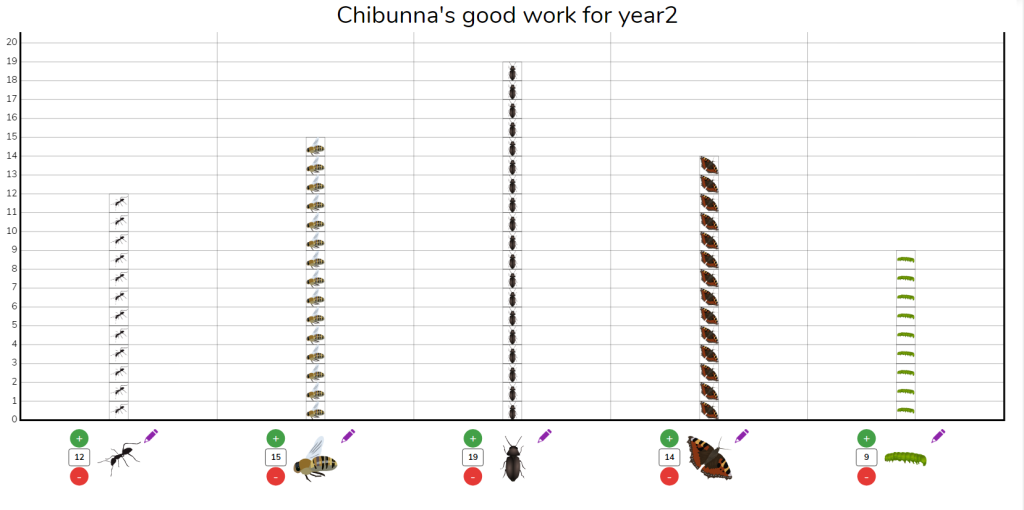
In Computing Year 2 have been learning about collecting data and presenting it appropriately. They have looked at the use of tally charts and pictograms. The children leant how they can select the program 2count in purplemash to create pictograms.
We also looked at questions we could ask. For example, How does the Pictogram show the most popular minibeast?



Don’t forget to log on through Wonde at home and try 2count at home as well!